.png)
.png)
BIA analysis of the Office for Life Sciences 'Strength and Opportunity' and 'Life Sciences Competitiveness Indicators' data
Last week the government produced two reports looking at the vital statistics of the UK life sciences industry and the international competitiveness of the UK environment for life sciences businesses. Here we take a brief look at the data and pick out some interesting statistics.
Strength and Opportunity 2017 – the life sciences industry’s vital statistics
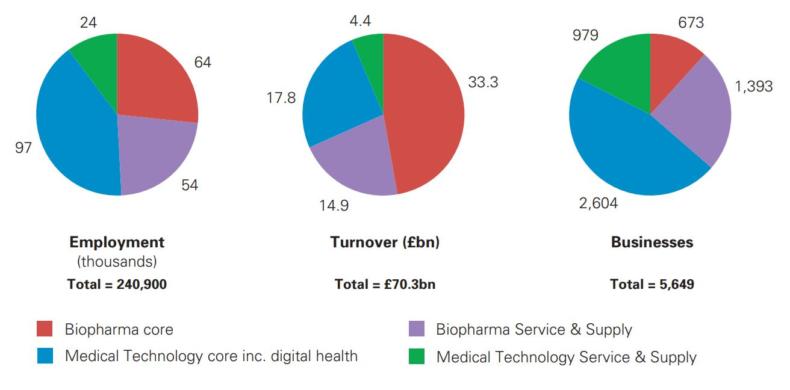
The first report published by the Office for Life Sciences is Strength and Opportunity 2017. It looks at the vital statistics of the life sciences industry split into biopharmaceuticals and medical technology sub-sectors, which are further split into core and service & supply.
The report reveals the life science industry as a whole employs almost 240,900 people, which is approximately 1.0% of all private sector employment. There are 5,649 businesses generating approximately £70.3bn in annual turnover.
Biopharma and med tech employ roughly equal numbers of people and, despite med tech accounting for two-thirds of businesses (63%), biopharma generates over two-thirds of the total industry’s turnover (68%).
Between 2016 and 2017 the industry grew by 2.4% for employment and 9.3% for turnover. The increase in turnover was due to a significant increase in the turnover of three businesses, two of which were in the small molecules segment. Excluding the increase due to these businesses, turnover for the industry increased 2.5%.
The report is accompanied by a spreadsheet containing the data behind the analysis, which lists every company along with some key information on each of them. It is a very valuable resource and worth your time exploring further.
The Life Science Competitiveness Indicators
The Strength and Opportunity report clearly shows we have a thriving life sciences industry, but how does it compare internationally and is the UK environment attractive for life science businesses compared to our international competitors? Alongside Strength and Opportunity, the Office for Life Sciences also published the Life Sciences Competitiveness Indicators - a set of metrics that shows UK performance compared to a range of comparator countries.
In this year’s report, the indicators have been reorganised into chapters that align with the five key themes of Sir John Bell’s Life Sciences Industrial Strategy, published last year.
Reinforcing the UK science offer
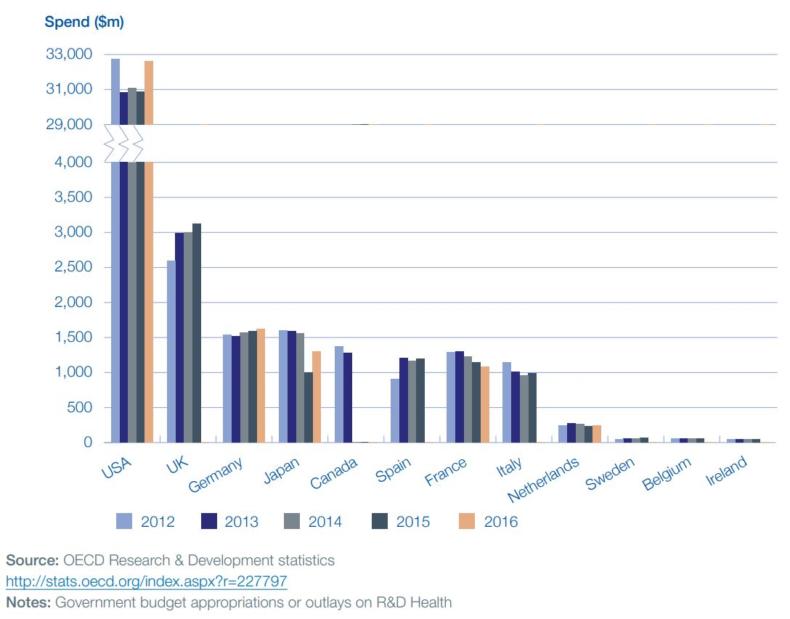
The indicators show that the UK continues to punch well above its weight in many areas. For example, the UK’s share of the top 1% of life sciences academic citations was 18% in 2014 (the most recent year data is available for), which ranks us behind only the US. The UK also ranks second only to the US in government health R&D investment, spending $3.1bn in 2015. It’s worth noting that the UK government spends ten times less than the US on health R&D but gets only four times fewer citations for that investment.
Looking at industry investment, the metrics show the UK pharmaceutical sector has the highest R&D spend of all business sectors, with £4.1bn in 2016, representing a fifth of total industry R&D spend.
The report also shows that the UK accounts for 3.1% of global patients recruited into clinical trials, ranking us fourth, but our recruitment speed could be improved – the UK is seventh for the amount of time taken to enrol the first patient following the regulator receiving the core package.
Growth and Infrastructure
The growth and infrastructure chapter is the most data-rich section of the report, providing productivity indicators (GVA), import and export values, foreign direct investment and fundraising data. However, the data is drawn from multiple sources and the definition of life sciences varies throughout. This means it differs from other published data, such as our own and Strength and Opportunity, which are more specific.
However, some interesting stats to pull out are that in 2017 there were 60 life science foreign direct investment projects in the UK – the highest in the past 7 years, the highest number in Europe and second only to the US. The value of life sciences foreign direct investment capital expenditure in the UK was £747m, ranking the UK fourth.
Gross Valued Added (GVA, which measures the contribution to the economy of an industry) for UK pharmaceutical manufacturing remained steady at £9.2bn. UK life sciences GVA represents 7.3% of UK total manufacturing GVA and 0.7% of the GVA for the UK economy as a whole. For the latest year of data available, UK ranked sixth internationally; Switzerland and Germany continue to be two European countries with the most productive pharmaceutical manufacturing sectors.
NHS collaboration
In his strategy, John Bell rightly points out that access to and diffusion of innovative products in the NHS is often slower than in some comparable countries. The latest set of indicators suggests this is still the case. For medicines first marketed between 2012 and 2016 and recommended by NICE, median UK uptake per capita of NICE-approved medicines in the first year after launch was at 21% of comparator countries. This rose to 78% by year five. These figures represent a decline in uptake when compared to the previous set of indicators which showed that for new NICE-approved medicines marketed between 2011-2015 the median UK uptake per capita was at 80% of comparator countries. When it comes to access and diffusion it seems that the UK may be becoming less internationally competitive, not more.
Skills
The report only includes one metric for skills – the proportion of graduates from natural sciences, mathematics and statistics degrees or equivalents. In 2015, 13.4% of graduates were from these programmes, roughly similar to the previous two years, following an increase of 4 percentage points between 2012 and 2013.
Perhaps future reports could also look at apprenticeship enrolments and even the UK’s ability to attract international scientific and medical talent.
Regulation
There’s also only one metric for the regulation section – the proportion of European Medicine Agency procedures where the MHRA has taken the lead role. The MHRA took a lead role in 25% of EU regulatory procedures in 2017. Of course, the outcome of negotiations over the UK’s future relationship with the EU will have a significant impact on this metric in coming years.
This blog provides a snapshot of some of the statistics we found most interesting in the two reports. There’s a wealth of more detail in both, which we would encourage you to read for yourself.